About SpectroArt

SpectroArt uses state-of-the-art, proprietary technology to capture the spectrogram content (frequency over time) of commercial music. This data is converted into a 3D model and manufactured using high-detail resin to create breathtaking translucent models you can hold.

The real thing...

The unique landscape of music combined with our custom-engraved base creates a product unlike anything seen before. For the first time, not only can you listen to your favorite music, but now, you can hold it in your hands and *feel* it’s intricate details.

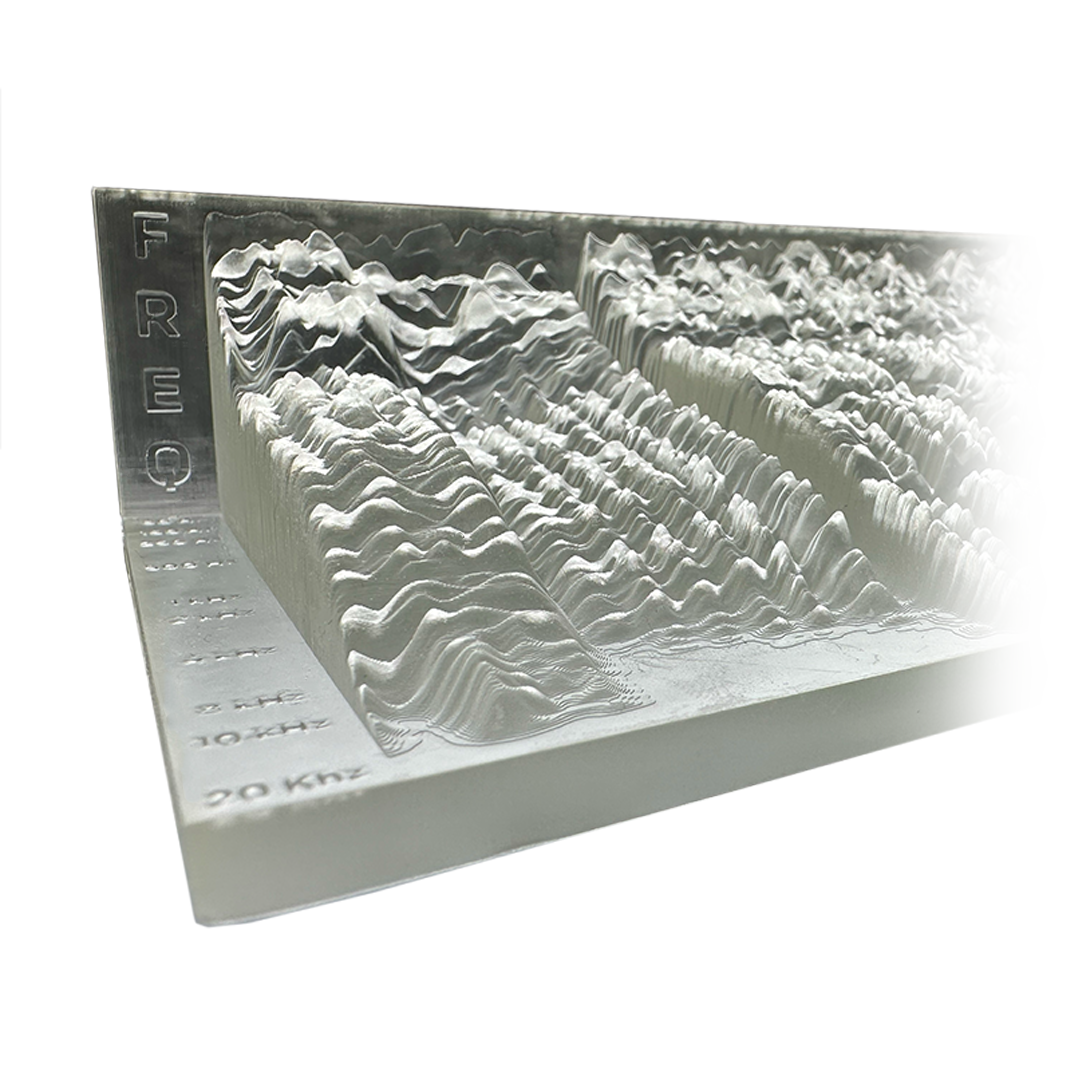
High-detail Engravings

Our base's engravings provide information on the song title, artist name, spectrogram start & stop times and highly-accurate frequency indicator.
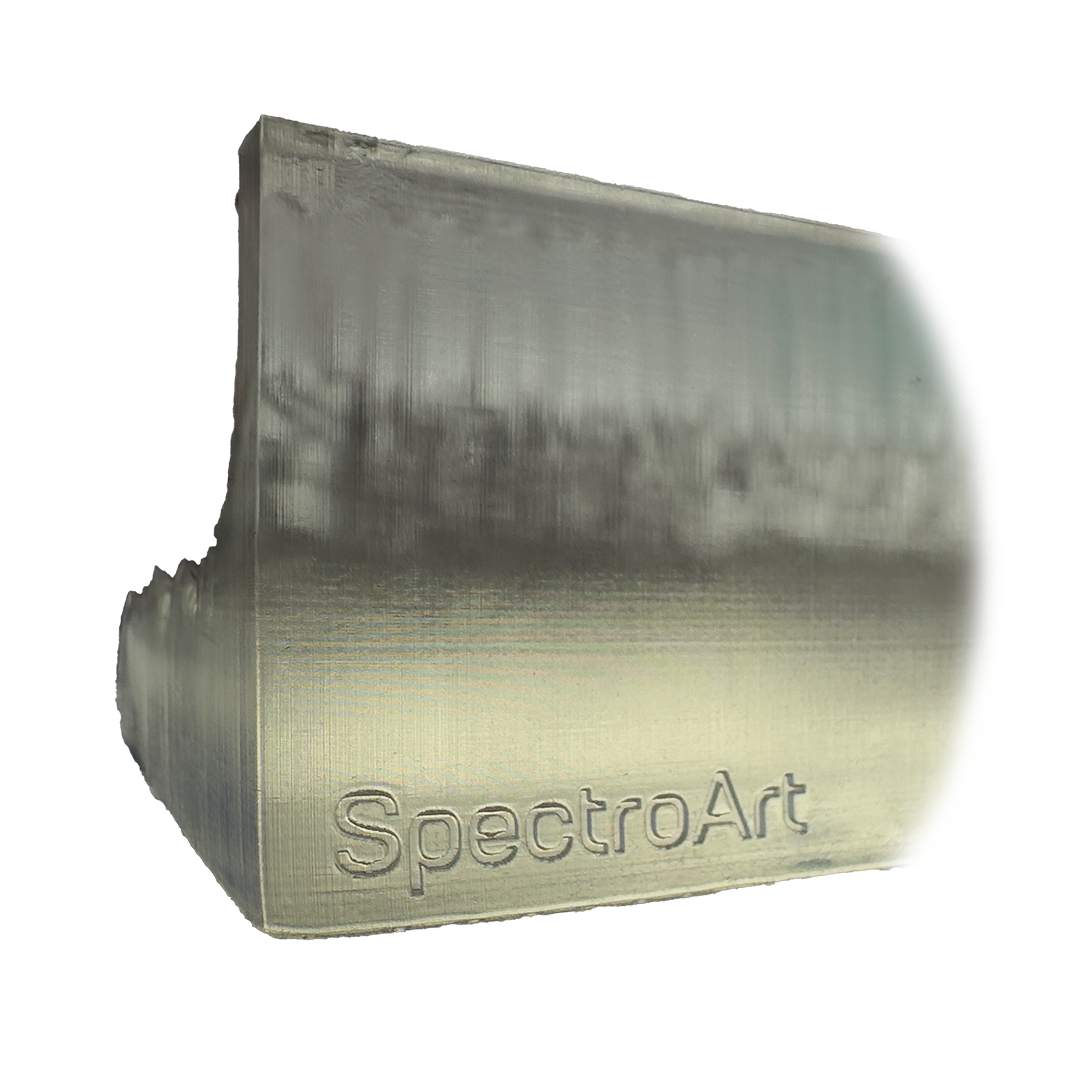
One of a kind

SpectroArt has redefined how you interact with music, crafting our pieces with as much attention to detail as the song itself. Nothing on the planet captures the essence of music with the precision of SpectroArt pieces.

  • Materials

    This product is made using a high-detail resin 3D printer. The combination of SpectroArt's printing method and materials allow for incredibly fine details and a smooth surface. Each product's translucent properties enable it to come to life when illuminated on SpectroArt's wooden LED light bases.

  • Dimensions

    The base of the model is 7" x 3.5" with a height of 1.75", making it a stunning addition to your desk space, coffee table, or fire place.

  • Song Information

    Each product features a engravings along the top of the product detailing the song title and artist. Alongside the start & stop time of the displayed spectrogram, a Frequency indicator is engraved on the left side, enabling the easy frequency identification. The height of each frequency on the model indicates how loud they're heard in the song.

1 of 3

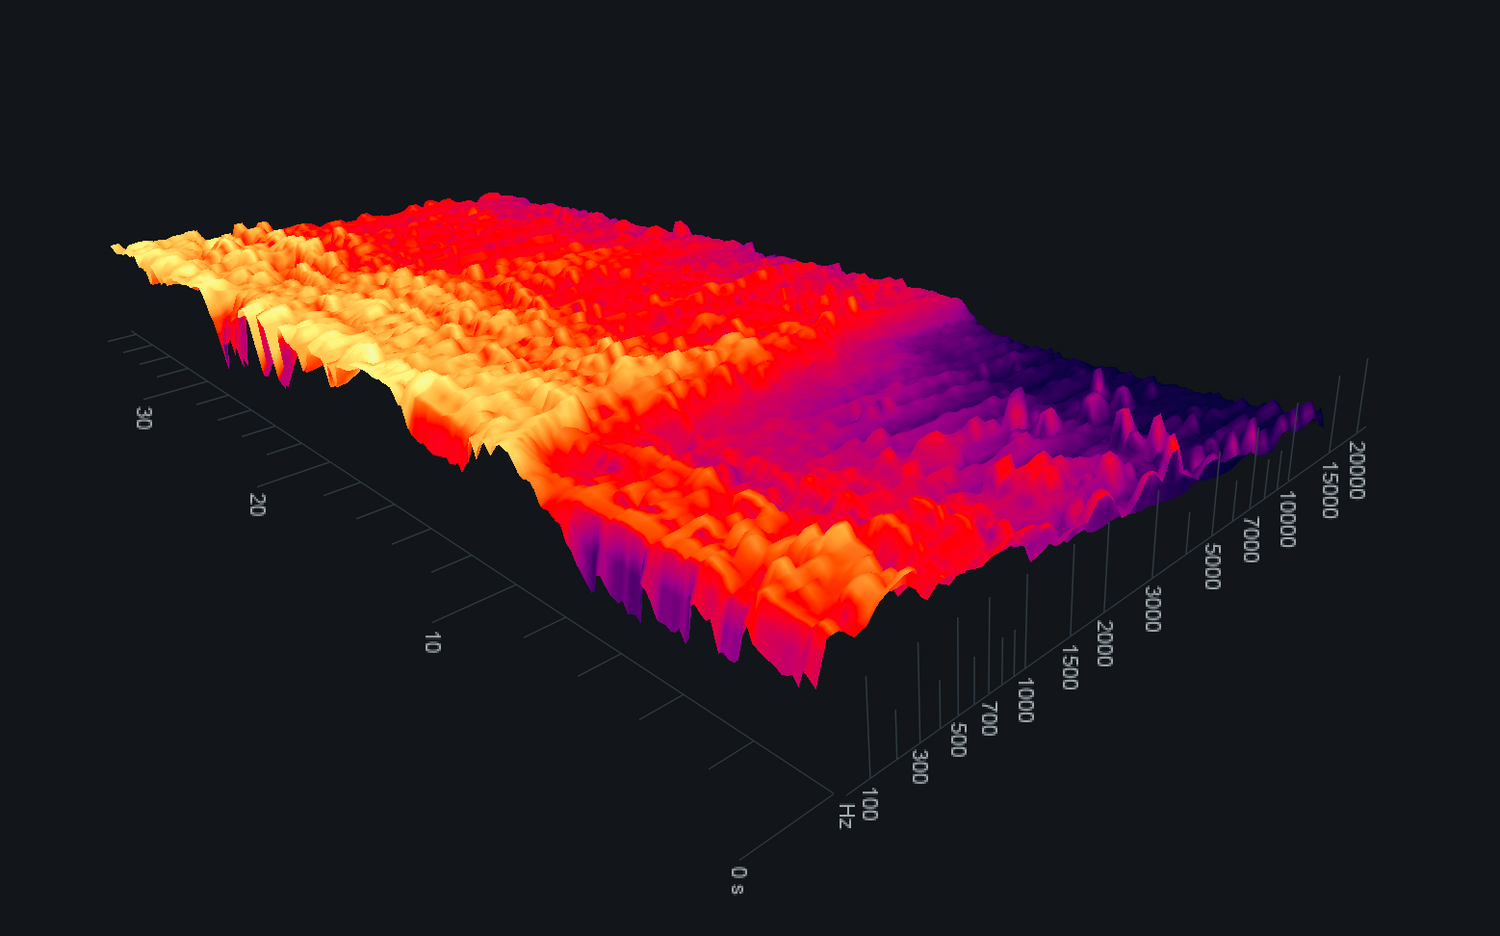
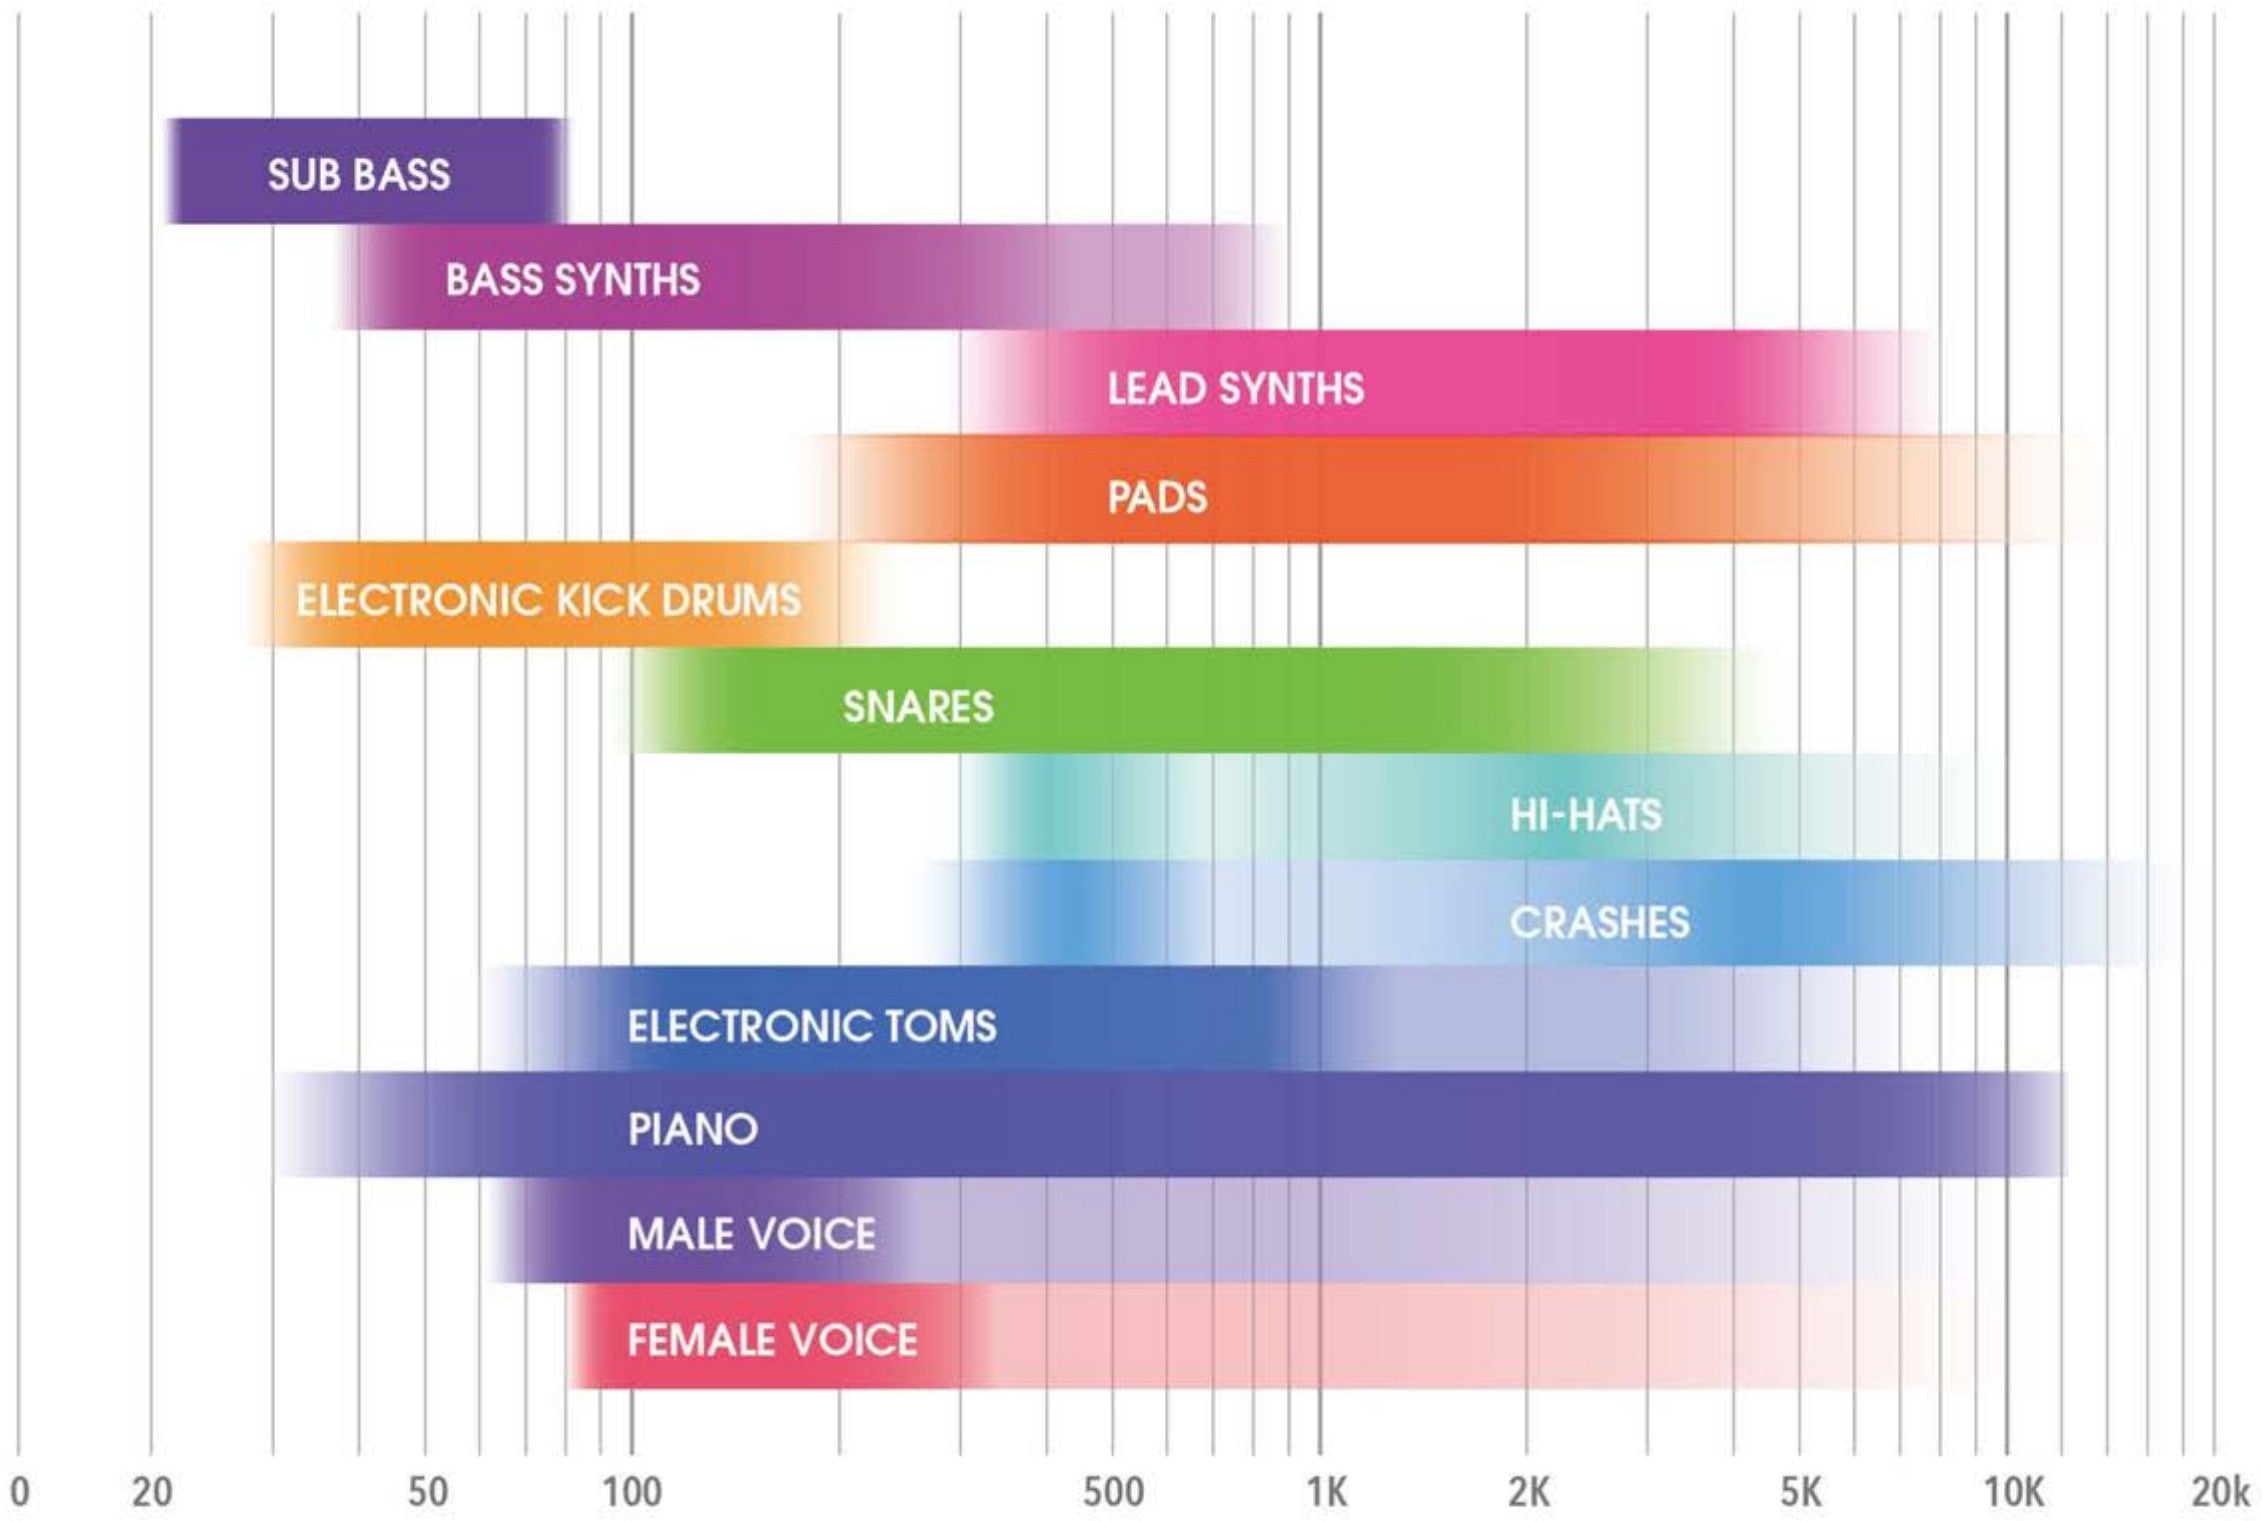
What is a Spectrogram?

A spectrogram is a visual representation of a song's frequency spectrum as it varies in amplitude over time. All music contains frequency content from 20Hz to 20kHz & when these changes are visualized, beautiful sonic landscapes are created...

Reading a Spectrogram

In order to understand what you're seeing, it helps to know what frequency range instruments live in, as can be seen in the chart below.